Know what you have. Know how long it lasts.
A 24-month cashflow model and live dashboard for real estate developers. Built to surface the numbers your lender, board, and project manager need — automatically.
WANT TO SEE IT FOR YOUR SECTOR?
Your project doesn't fail on paper. It fails in cash.
Cashflow surprises do not come from nowhere. They come from models that are built once and never touched again, cost trackers disconnected from the forecast, and collections data that lives in someone's head.
This system connects those pieces. You enter your project once. It tracks the gap, flags the risks, and shows you exactly what month the pressure arrives — before it does.
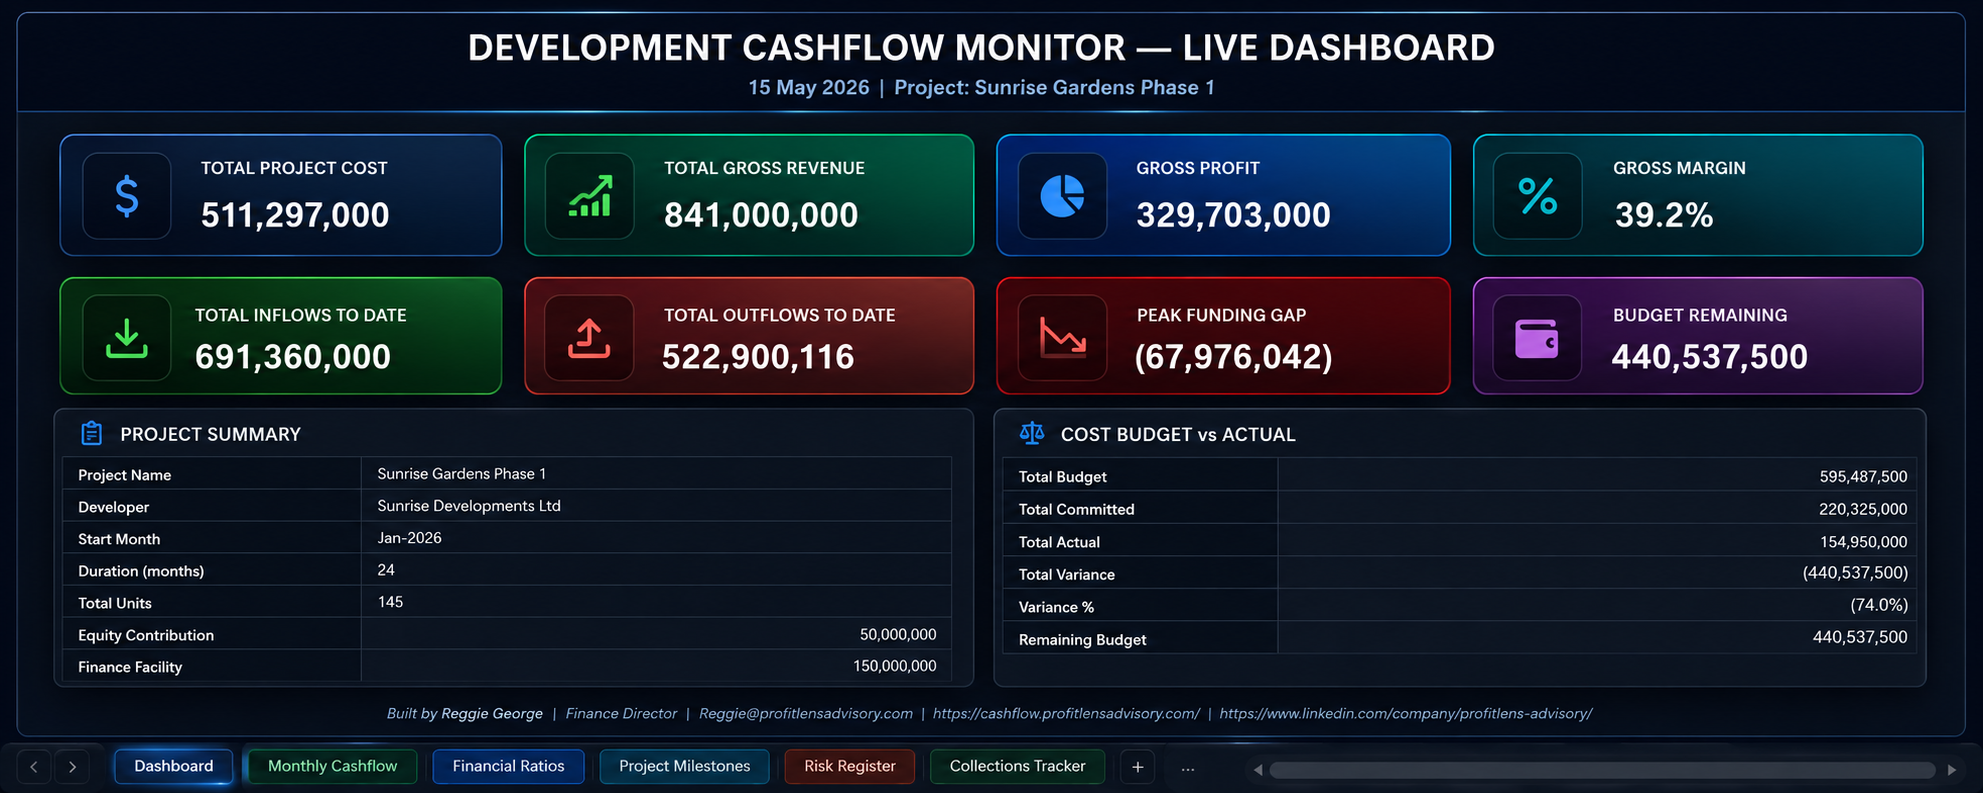
The live dashboard is deliberately darker and more technical. It is the operator view: funding position, risk movement, collections, cost variance, and the monthly cash schedule in one place.
Funding gap visible early
The first screen shows whether the facility covers the peak shortfall and when the project moves from funded to exposed.
Risk is translated into action
Collections, cost overruns, and active risks are converted into management priorities instead of sitting in separate tabs.
Board-ready without the file
The dashboard is opened through a private link, so the discussion moves to decisions rather than spreadsheet navigation.
“We recovered over KSh 200 million in delayed receivables, rebuilt our financial controls, and moved our receivables turnover from 4x to 6x. The work was thorough, practical, and consistently delivered results.”
Custom pricing available for portfolio monitoring or multi-phase projects. Get in touch →
9 tabs. Pre-loaded with a real project. Replace the numbers, own the output.
Live system — open directly, no login required.
This is a real project simulation. The same system runs on your data — same metrics, same signals, same funding gap logic. Open it on your phone, share the link, and use it as the room everyone looks at.
Open live demo →